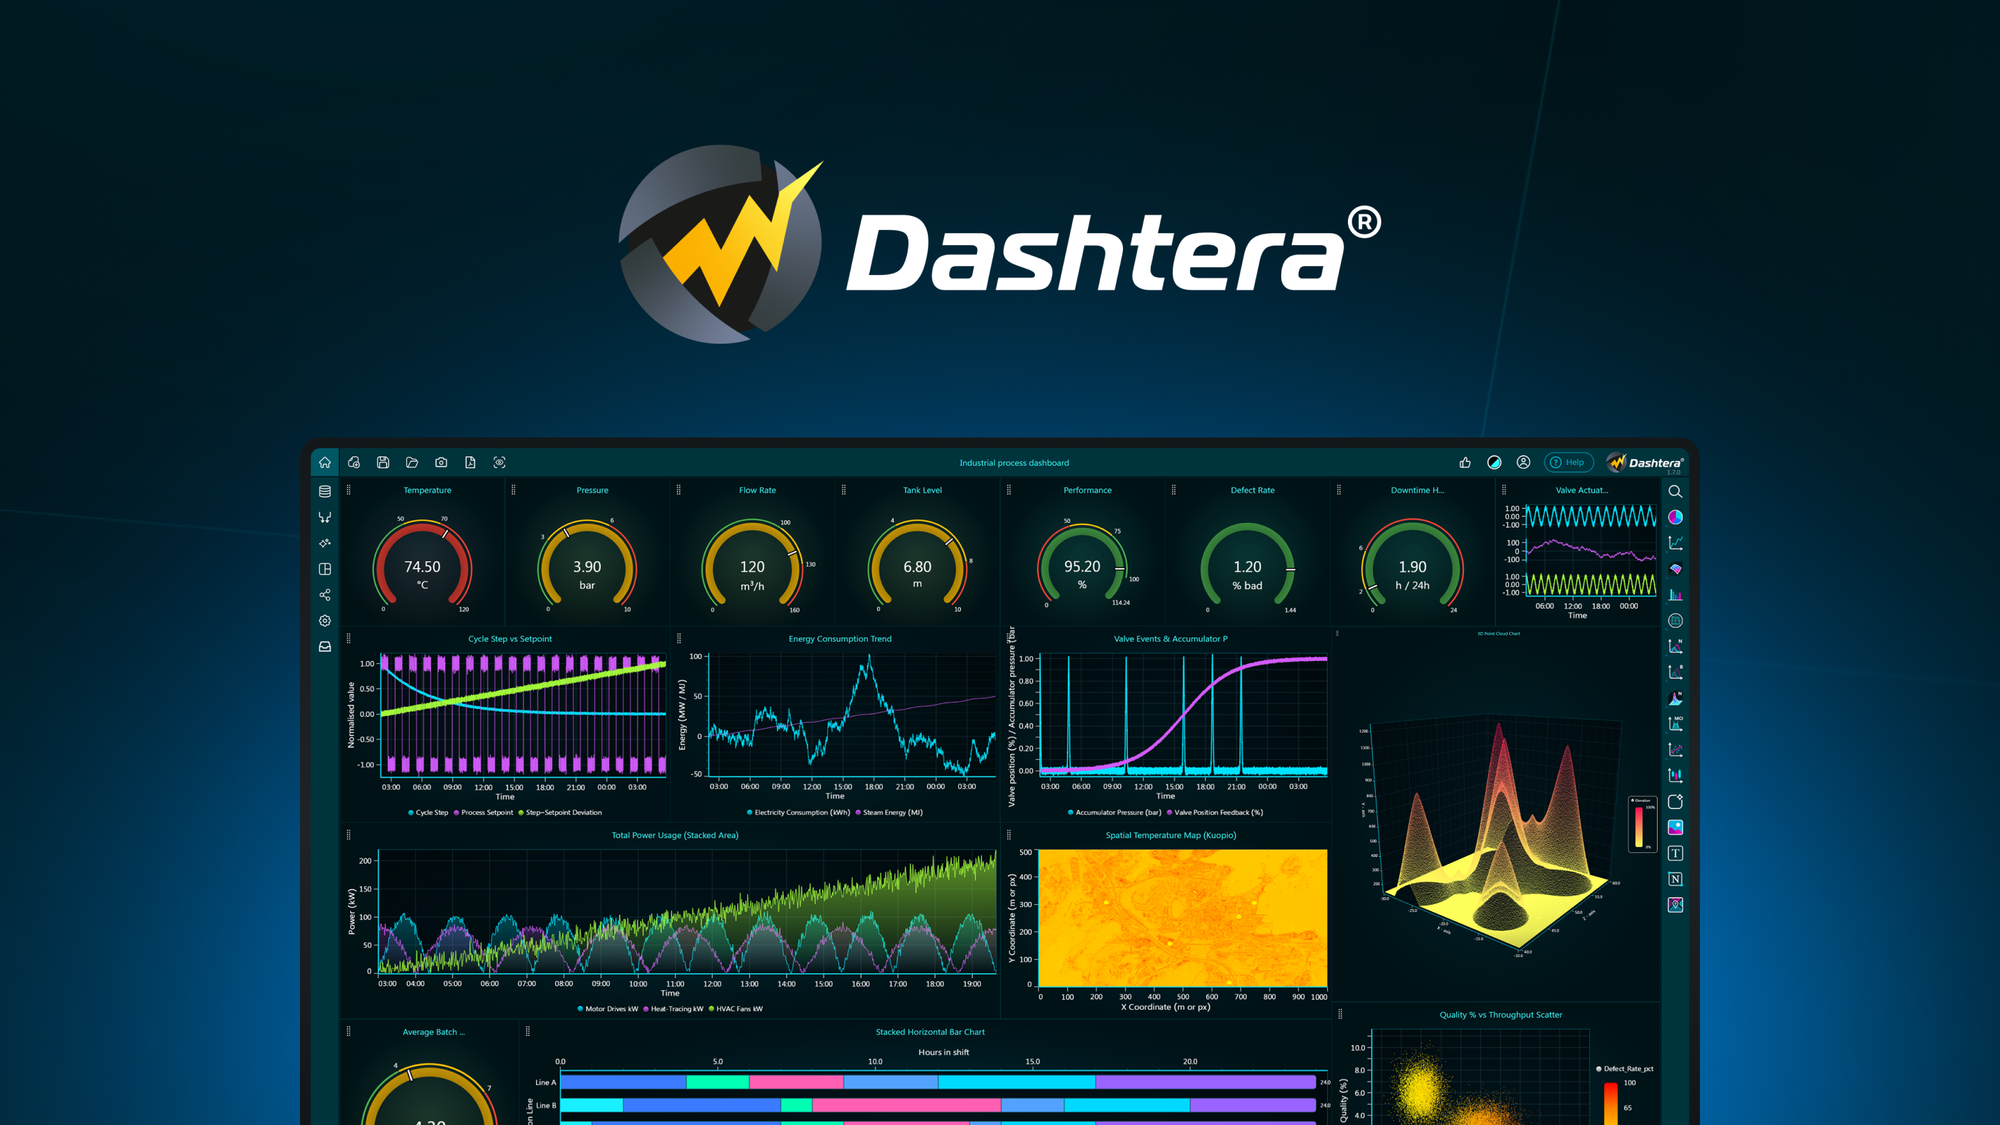

Transform raw data into real-time dashboards with GPU-powered charts, interactive maps, and no-code setup
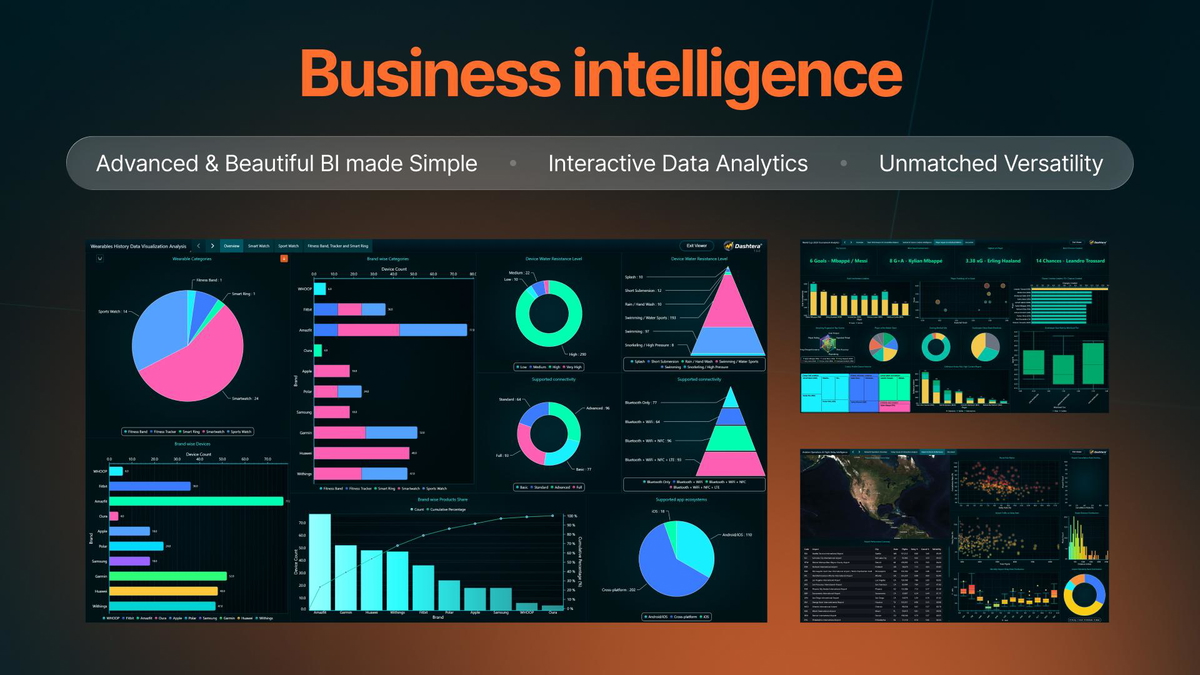
See your data from every angle
- Build dashboards with basic, XY, 3D, bar, and polar charts to visualize any dataset your way
- Spot trends and outliers instantly with KPI panels and statistics charts designed for fast scanning
- Map your data geographically using interactive, high-performance WebGL maps
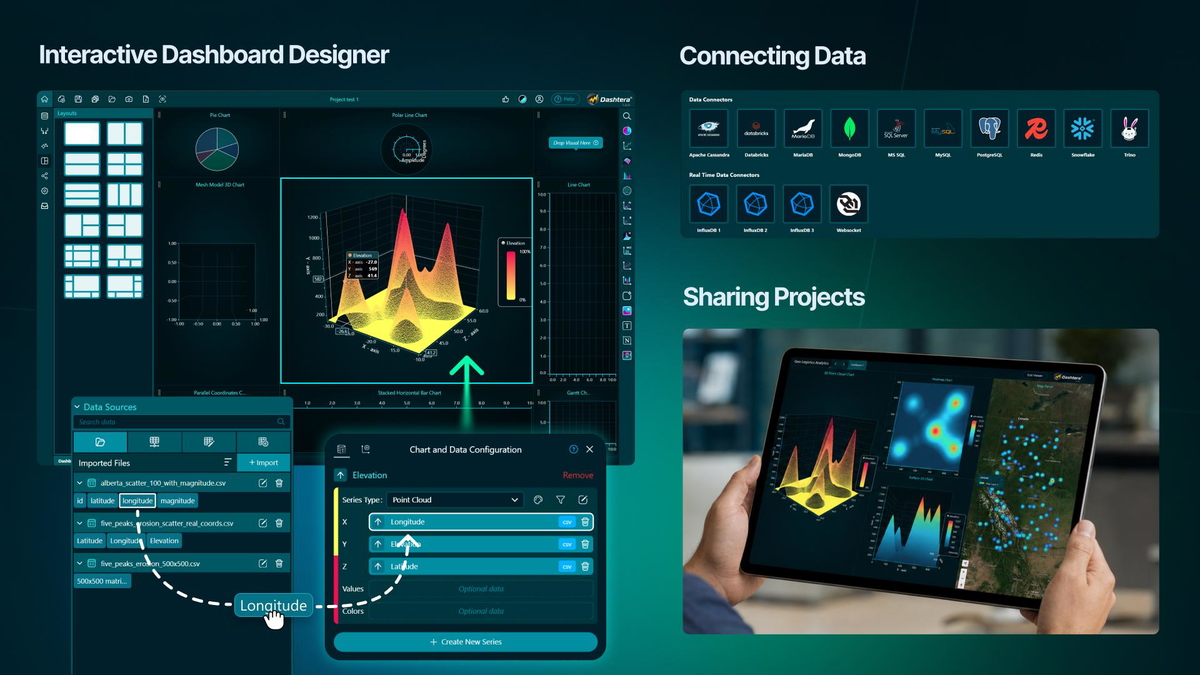
Work with your data, your way
- Connect to PostgreSQL, MySQL, SQL Server, MongoDB, InfluxDB, and more without writing a query
- Import data from CSV, JSON, and XML files to bring in exports, spreadsheets, or third-party data
- Design and arrange your dashboard using the built-in drag-and-drop editor
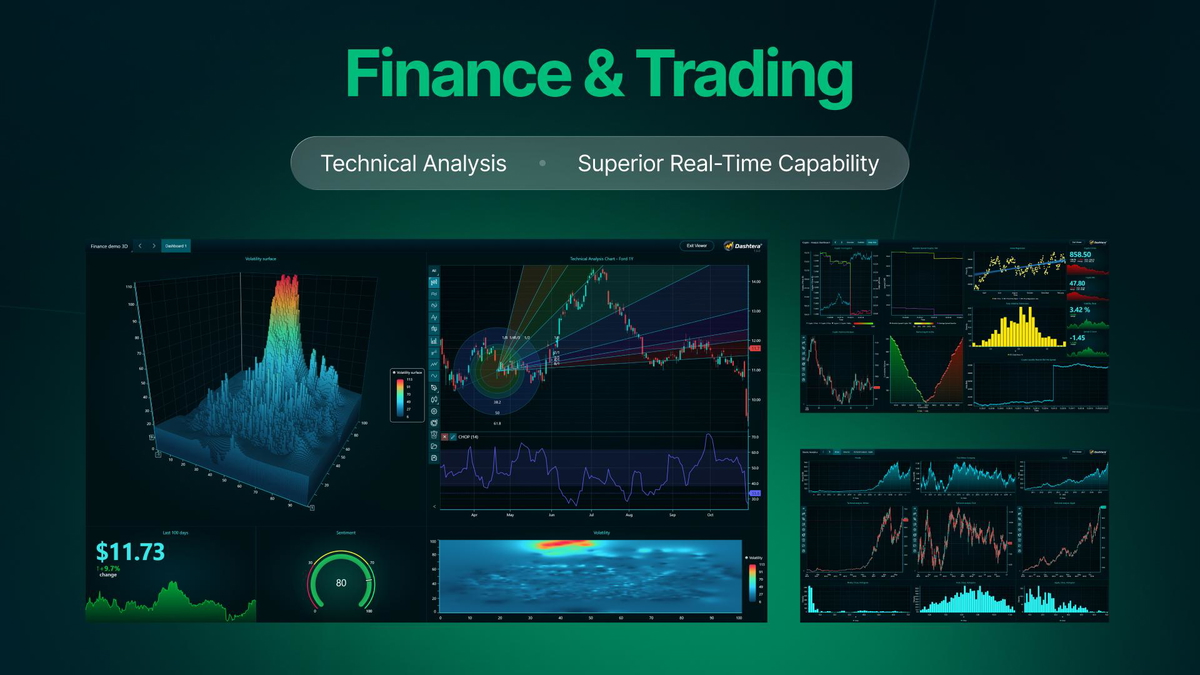
Track financial and trading data live
- Plot markets with technical analysis charts—candlesticks, overlays, and multi-series indicators included
- Drill down from portfolio-level views to individual trades using Dashtera’s drill-through navigation
- Stream real-time price feeds into responsive charts that reflect changes as they happen
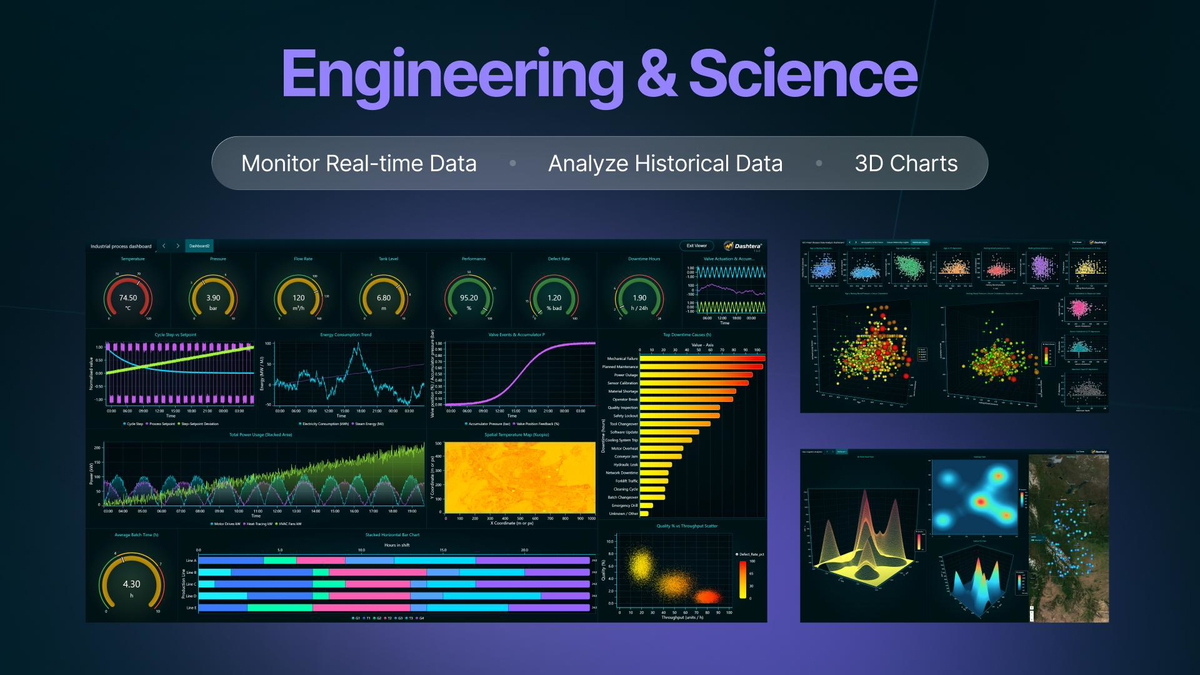
Monitor engineering and science data
- Track sensor output with real-time charts across IoT (aka Internet of Things), industrial automation, and telemetric applications
- Compare experiment runs using drill-down views and grouped data filtering
- Render 3D charts for surface, scatter, and elevation data across complex scientific datasets